Gallery


Average annual maximum temperature (ºC)
Funding source: Thailand Research Fund (TRF)
Principal investigator: Suppakorn Chinvanno
Researchers: Viriya Laung-Aram, Chalermrat Sangmanee , Jutatip Thanakitmetavut
Timeframe: July 2007-July 2008
Period: 12 months
Status: Completed
This project focused on
The future climate projection is the simulation of future possible climate scenarios in Thailand and surrounding countries at high resolution of grid size 20x20 km. and covers a baseline period from the year 1960 – 1999, which can be used for comparison, and the future period covers the from year 2010 – 2099. The simulation of this climate scenario is based simulation by PRECIS (Providing Regional Climates for Impacts Studies) regional climate model and used Global Circulation Model (GCM) ECHAM4 dataset as initial data for calculation. The simulation covers the Intergovernmental Panel on Climate Change (IPCC) emission scenarios A2 and B2. Results from the simulation operation provide high resolution future climate projection for Thailand and surrounding countries up to the end of the century.
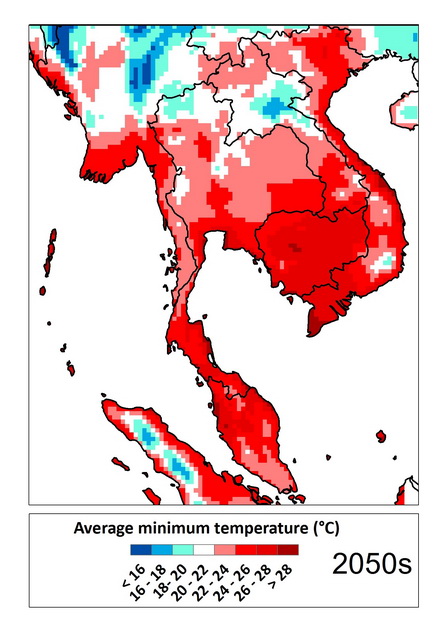
The results from PRECIS model were post-processed using a rescaling technique to derive results that are more in-line with the observed weather data. The final results of future climate projection shows trend of increasing temperature throughout Thailand, especially in the central plain of Chao Phraya river basin and lower part of north-eastern region. Hot period over the year will also be longer in the future. Total annual precipitation may fluctuate in the early part of the century but the projection shows clear trend of increasing precipitation from middle of the century onward, especially in the area near Mekong River as well as the southern region, except the western border, where future precipitation may remain almost unchanged. Change in wind speed and wind direction can be detected in the coastal zone, where south-west wind speed may increase by 3-5% in the future.


Average annual maximum temperature (ºC)


Average annual hot days (= >35ºC)


Average annual minimum temperature (ºC)


Average annual cool days (= < 16ºC)


Change in precipitation (%)compare to the baseline period of 1980s